There’s a useful number hiding in a test you’ve almost certainly already had — and almost no one calculates it. Your standard lipid panel already contains everything you need for one of the best cheap signals of insulin resistance: the triglyceride-to-HDL ratio. It costs nothing extra, and it often reveals metabolic risk that total cholesterol completely misses.
How to calculate it
Take two numbers straight off your lipid panel:
Triglyceride-to-HDL ratio = triglycerides ÷ HDL (same units — mg/dL in the US)
Example: triglycerides 150, HDL 50 → ratio 3.0. That’s it — no new test, no fasting beyond what the lipid panel already needs.
The stat most people don’t know
The triglyceride-to-HDL ratio is one of the best surrogate markers of insulin resistance you can get from a routine lipid panel — outperforming triglycerides or HDL alone in several studies (Kim-Dorner et al., NCBI). The reason it works: insulin resistance tends to push triglycerides up and HDL down at the same time, so dividing one by the other amplifies that exact signal.
What your ratio means
In US units (mg/dL):
- Below ~2 — generally favorable
- ~2–3 and rising — increasingly associated with insulin resistance
- Above ~3 — a stronger flag for metabolic risk
Study cutoffs range from roughly 1.5 to 3 depending on the population and ethnicity, so treat it as a signal to investigate rather than a hard diagnosis. Crucially, the ratio can be elevated even when your total cholesterol is “normal” — which is exactly why it catches what a single number hides.
Why it beats total cholesterol for metabolic risk
Total cholesterol lumps everything together and can look reassuring while masking a high-triglyceride, low-HDL pattern — the classic metabolic-risk signature. The triglyceride-to-HDL ratio isolates that pattern, tying your lipid panel directly to your blood-sugar and insulin picture and the broader metabolic syndrome cluster.
What this looks like in Bevita
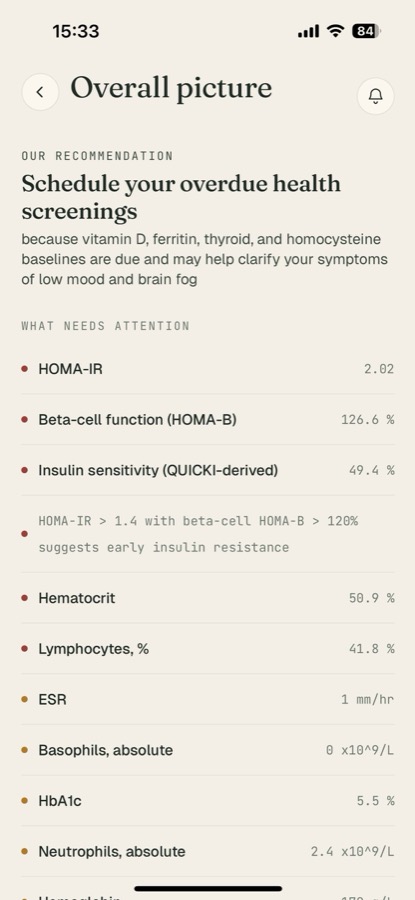
This is exactly the kind of derived marker Bevita calculates for you rather than leaving you to do longhand. It computes the triglyceride-to-HDL ratio from your lipid panel, flags it against the insulin-resistance range, and tracks it over time alongside HOMA-IR and glucose — so a ratio creeping up becomes visible proof of metabolic drift, not a calculation you’d never think to run.
What to do
- Calculate it from your last lipid panel — triglycerides ÷ HDL.
- Read it in context — a raised ratio suggests checking fasting insulin and glucose too.
- Track it over time — improvement in insulin sensitivity usually lowers the ratio.
- Talk to a clinician — use it as one input into your overall cardiometabolic risk.
References
- Kim-Dorner SJ, et al. Triglycerides-to-HDL cholesterol ratio as a surrogate marker for insulin resistance. NCBI / PMC.
- American Heart Association. About Cholesterol.
- Freeman AM, Acevedo LA, Pennings N. Insulin Resistance. StatPearls, NCBI.
This article is for education and isn’t medical advice. Discuss your results with a qualified clinician.
Track your ratio with Bevita
The triglyceride-to-HDL ratio is free, powerful, and easy to overlook. Upload your labs to Bevita and it calculates the ratio for you, flags it against the insulin-resistance range, and tracks it beside your metabolic markers over time. Download Bevita, upload your lipid panel, and read the metabolic signal hiding in it.