Your lipid panel has a line most people scroll straight past. It sits below the familiar four — total, HDL, LDL, triglycerides — and it’s usually the one nobody explains at the appointment.
Which is a shame, because it requires no extra blood, no extra cost, and no fasting, and in a fair number of studies it does a better job of predicting what you actually care about.
What it is: one subtraction
Non-HDL cholesterol = total cholesterol − HDL cholesterol.
That’s it. If your total is 210 and your HDL is 55, your non-HDL is 155.
What makes the arithmetic worth doing is what it captures. HDL broadly moves cholesterol away from artery walls. Everything else in the total carries cholesterol toward them. Subtract HDL and you’re left with the sum of every atherogenic particle in one number: LDL, yes, but also VLDL, IDL, remnant lipoproteins and Lp(a).
An LDL measurement covers only the largest of those categories. Non-HDL covers the set.
The stat most people don’t know
Non-HDL isn’t just tidier in theory. Studies have repeatedly found it holds up as a predictor at least as well as LDL, and sometimes better.
In one large analysis, non-HDL cholesterol level was a stronger predictor of coronary heart disease risk than LDL cholesterol (PubMed), and another found it a somewhat better predictor of cardiovascular mortality (PubMed). More strikingly, a cohort study following people from childhood into adulthood reported that childhood non-HDL-C predicted adult atherosclerotic cardiovascular events better than childhood LDL-C — particularly among people whose LDL-C looked normal while non-HDL-C was elevated (Circulation).
That last group is the point of this article. If your LDL came back fine and everyone moved on, non-HDL is the number that would have flagged you.
The targets
The convention that’s been in use longest is refreshingly simple: the non-HDL goal sits 30 mg/dL above the LDL goal (NCEP ATP III, NHLBI). Which gives, by risk category:
| Risk level | LDL-C goal | Non-HDL-C goal |
|---|---|---|
| Low (0–1 risk factors) | < 160 mg/dL | < 190 mg/dL |
| Moderate (2+ risk factors) | < 130 mg/dL | < 160 mg/dL |
| High (CHD or equivalent) | < 100 mg/dL | < 130 mg/dL |
For adults at average risk, under 130 mg/dL is the figure usually cited as optimal.
Worth knowing: the 2026 ACC/AHA dyslipidemia guideline brought explicit LDL-C and non-HDL-C treatment goals back into use for guiding lipid-lowering therapy, with LDL-C targets of under 100 mg/dL at borderline or intermediate risk, under 70 at high risk, and under 55 for secondary prevention (ACC). Non-HDL moved from footnote to co-target.
Units note: outside the US these are reported in mmol/L. Divide mg/dL by about 38.7 — a non-HDL of 130 mg/dL is roughly 3.4 mmol/L.
Where non-HDL beats LDL outright
There’s one situation where non-HDL isn’t merely a useful addition but strictly more trustworthy.
Most labs don’t measure LDL directly. They estimate it with the Friedewald equation, which subtracts an assumed VLDL contribution derived from triglycerides. When triglycerides run high — above roughly 200, and badly above 400 — that assumption breaks down and calculated LDL becomes unreliable, usually reading falsely low.
Non-HDL has no such weakness. It’s two directly measured values and a minus sign. This is exactly why ATP III positioned non-HDL as the secondary target in people with elevated triglycerides, and it’s the reason a “normal” LDL alongside high triglycerides deserves a second look.
The same reasoning is why ApoB has gained ground: it counts atherogenic particles directly. Non-HDL is the free approximation of that idea, already sitting on the panel you’ve had. For how the whole panel fits together, start with what your cholesterol numbers mean.
What this looks like in Bevita
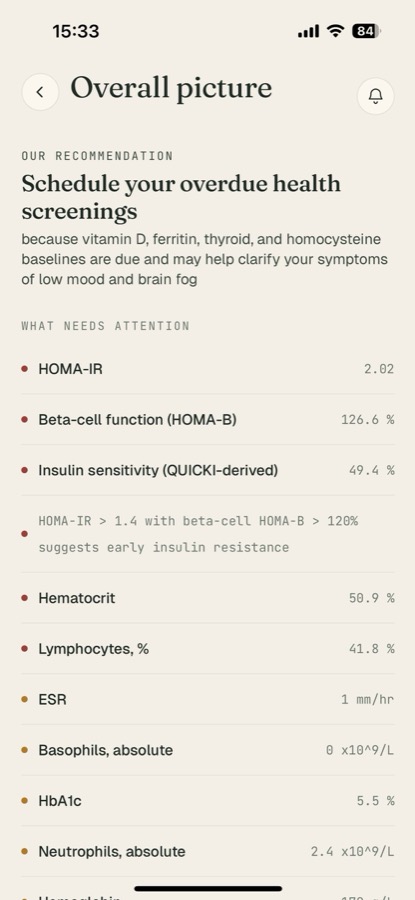
Non-HDL is a good illustration of why a PDF from the lab is a poor place to keep your health. The number is derivable from data you already have, but no one computes it for you, and comparing it across years means opening several files.
Bevita reads the panel, keeps the values with their dates, and shows the markers in relation to each other on a screen like this — so a rising non-HDL alongside rising triglycerides reads as one pattern rather than two unrelated lines in two different documents. That relational view is the difference between having your labs and understanding them.
What to do
- Calculate it now — total minus HDL, using the panel you already have. No new test needed.
- Check it against your risk category, not against the lab’s generic flag.
- Look at it especially hard if your triglycerides are above 200, where calculated LDL understates the problem.
- Track it over time. One value is a snapshot; the direction is the story.
- Talk to a clinician about your risk category and whether ApoB or Lp(a) would add anything for you.
References
- National Cholesterol Education Program. Third Report of the Expert Panel on Detection, Evaluation, and Treatment of High Blood Cholesterol in Adults (ATP III), Executive Summary. NHLBI.
- Non-high-density lipoprotein and very-low-density lipoprotein cholesterol and their risk predictive values in coronary heart disease. PubMed.
- Non-high-density lipoprotein cholesterol level as a predictor of cardiovascular disease mortality. PubMed.
- Childhood Non-HDL Cholesterol and LDL Cholesterol and Adult Atherosclerotic Cardiovascular Events. Circulation.
- American College of Cardiology. ACC, AHA Release New Clinical Guideline For Managing Dyslipidemia (2026).
This article is for education and isn’t medical advice. Discuss your results with a qualified clinician.
See your lipids as a pattern, not four numbers
Non-HDL cholesterol is already hiding in the results you have — and it means more next to your triglycerides and your history than it does alone. Upload your labs to Bevita and it reads the whole panel, tracks each marker over time, and shows you how they move together. Download Bevita, upload your lipid panel, and find the number nobody explained to you.