You get your blood test results back. There are 30+ numbers, each with a reference range, some flagged with arrows. Your doctor spends 2 minutes going over them. What do they all actually mean?
The basics: what you’re looking at
Every lab report has the same structure:
- Test name — what was measured (e.g., “Ferritin”, “TSH”, “Glucose”)
- Your value — the number the lab found
- Reference range — what’s “normal” for your age and sex
- Units — how it’s measured (ng/mL, mIU/L, mg/dL, etc.)
- Flag — arrow up (high), arrow down (low), or nothing (normal)
The most important numbers to know
Ferritin (iron storage)
- What it measures: How much iron your body has stored
- Normal range: 12-300 ng/mL (varies by sex)
- Optimal: 40-100 ng/mL
- Why it matters: Low ferritin = fatigue, brain fog, hair loss. High ferritin = inflammation or iron overload.
TSH (thyroid)
- What it measures: How hard your thyroid is working
- Normal range: 0.4-4.0 mIU/L
- Optimal: 0.5-2.5 mIU/L
- Why it matters: High TSH = possible hypothyroidism. Low TSH = possible hyperthyroidism.
HbA1c (blood sugar average)
- What it measures: Average blood sugar over 3 months
- Normal range: Below 5.7%
- Prediabetes: 5.7-6.4%
- Diabetes: 6.5%+
- Why it matters: Most accurate long-term sugar marker. More reliable than fasting glucose.
LDL Cholesterol
- What it measures: “Bad” cholesterol
- Normal range: Below 100 mg/dL (optimal)
- Why it matters: High LDL = increased cardiovascular risk.
Vitamin D
- What it measures: Vitamin D level
- Normal range: 30-100 ng/mL
- Optimal: 40-60 ng/mL
- Why it matters: Low vitamin D = weak bones, poor immune function, mood issues.
Reference ranges above are drawn from standard clinical sources — AAFP (ferritin), NIDDK (TSH), American Diabetes Association (HbA1c), American Heart Association (LDL), and NIH Office of Dietary Supplements (vitamin D). Ranges vary by lab and guideline.
What “normal” actually means
Here’s the important part: normal range ≠ optimal range.
Your lab says your ferritin of 25 is “normal” (range starts at 12). But research suggests ferritin below 30 can cause symptoms. Your doctor might say “it’s fine” — but you feel tired all the time.
This is why tracking over time matters more than any single number. A ferritin of 25 that was 85 six months ago tells a different story than a ferritin of 25 that’s been stable for years.
What this looks like in Bevita
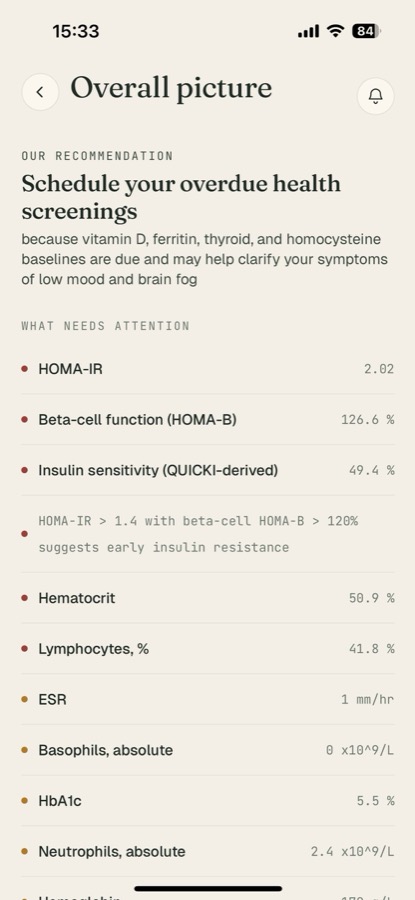
This is the version of a lab report that answers the question you actually had. On this Bevita “Overall picture” screen the markers are grouped by system with a plain-language status, so you’re reading “here’s what needs attention” rather than decoding thirty rows of reference intervals.
Upload your PDFs as you collect them and Bevita extracts the values, keeps them with their dates, and shows each marker’s direction over time. The 30-number report becomes a handful of things worth knowing — which is the whole point of reading your results in the first place.
What to do with your results
- Don’t panic. Most flags are minor and temporary.
- Look at trends. One result is a snapshot. Three results over 12 months is a story.
- Connect to symptoms. If your ferritin is low AND you’re tired — that’s a pattern.
- Ask your doctor. “Should we retest in 3-6 months?” is always a good question.
- Track them. Don’t let results sit in a folder. Put them somewhere you can find them — we compared the best apps for tracking blood test results if you want a starting point.
References
- American Family Physician (AAFP). Iron Deficiency Anemia: Evaluation and Management.
- National Institute of Diabetes and Digestive and Kidney Diseases (NIDDK). Hypothyroidism (Underactive Thyroid).
- American Diabetes Association. Understanding A1C.
- National Institutes of Health, Office of Dietary Supplements. Vitamin D — Health Professional Fact Sheet.
This article is for education and isn’t medical advice. Discuss your results with a qualified clinician.
Track your results with Bevita
Bevita uploads any lab result, extracts every value, tracks trends over time, and connects your biomarkers to your symptoms. When your doctor asks “how have your levels been?” — you have the answer.
Free tier. Upload your first result in 30 seconds.